Sensitivity and specificity can be confusing concepts, whether they are shown as formulas or probability statements (I like the latter, but this might be because I trained a lot in probability).
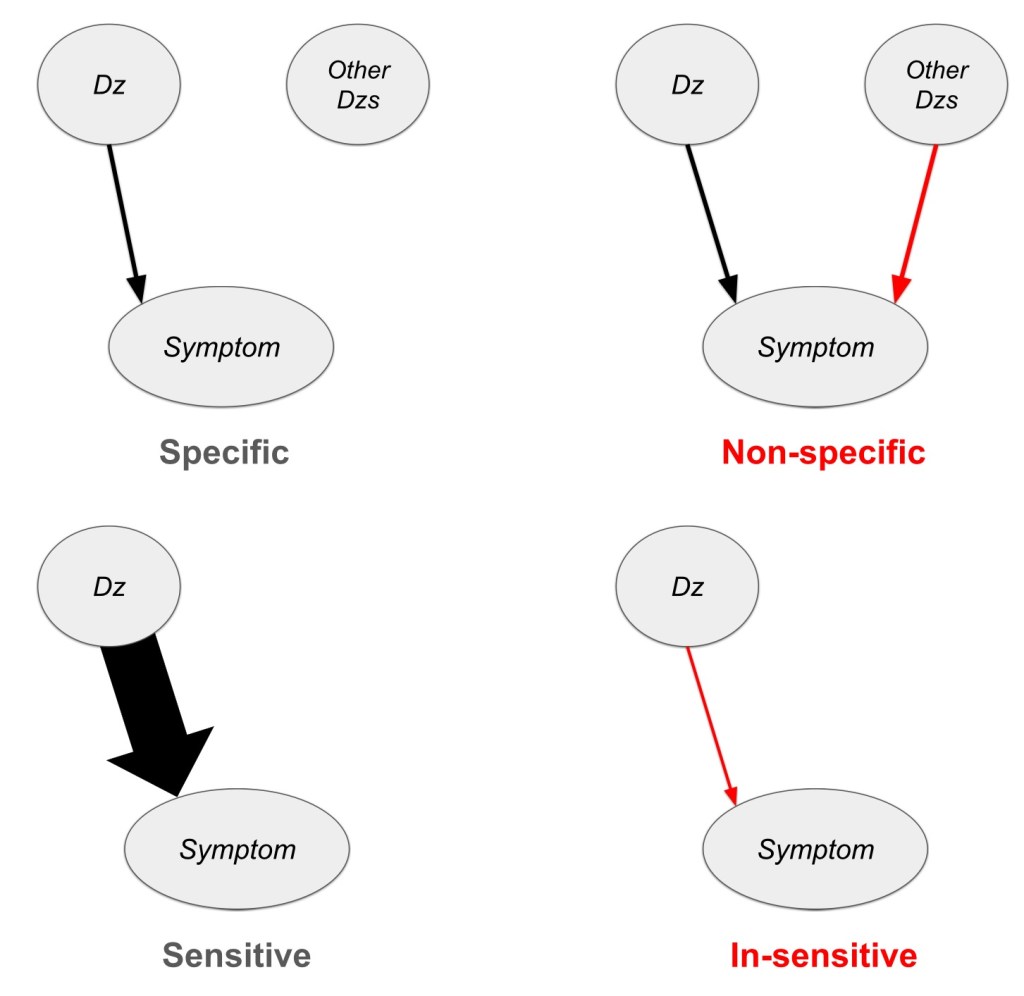
Here, I show a hopefully more intuitive, graphical view of sensitivity and specificity.

Leave a comment